When I created Mapping God’s Bloodline, I had no idea what a turning point it would be for this website. Until then, few had visited the site. Once a few influential people shared it on social media, I discovered how visualization could turn a boring, tedious subject into something people find highly engaging.
Previously only top-end software would allow students of scripture to easily find where God is called “Lamb,” “Word,” “Prince,” “Son,” “He,” “I,” etc. Timothy, the developer of Bible Analyzer, recently completed efforts to tag references like those for over 25,000 words to offer similar functionality in a low-cost program.
Click the image to download a high-resolution version.
Order prints here. Click the image to download a high resolution version.
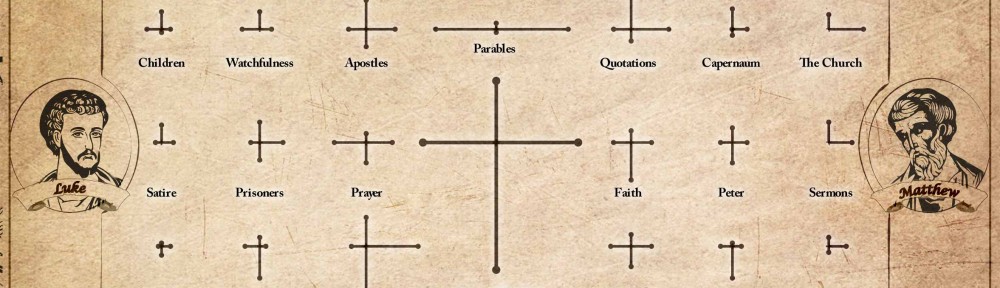
The Gospels tell the story of Jesus Christ, each one emphasizing different aspects of his time and teachings. A typical harmony of the Gospels lays out all the events and references the passages that describe them in each book. This chart takes a different approach by comparing the broader topics illuminated by those verses.
The sides of each cross are scaled according to how often a topic is dealt with in the corresponding book (as a percentage of the total number of verses in that book). The right side represents Matthew, the top is Luke, left for Mark, and the bottom line goes with John. The topics and verse references are from the topical index in MetaV which has a mashup of Nave’s Topical Bible Concordance and Torrey’s New Topical Textbook.
A Valid Approach?
It is common to hear a pastor tell how often a certain word appears in the Bible or in a particular book to support his point. But, is this an accurate representation? One can discuss the topic of faith, for instance, without ever mentioning the word directly. I could envision many ways in which the word-count approach would leave a false impression.
It may be more accurate to look at topics and to compare them against each other to see their relative prominence. But, even this approach can have its distortions. It relies on indexes produced by people in a particular culture and historical period. That could introduce some bias in assigning topics to each verse, thereby skewing the whole thing – consciously or not. Overall, however, the comparisons here line up well with what you would conclude after reading it all for yourself (by far the best approach).
About that one in the middle…
It should be no surprise that the lines representing Jesus Christ would be the longest. If it had turned out any other way, I would have begun looking for errors in my data. What is surprising, however, is that the lines form a nicely proportioned cross. According to the topical indexes I chose, John focuses more on Jesus, Mark slightly less, and the others hit close to the average. I’ll leave it to the reader to decide if this is a convenient coincidence or a divine design.
Due to space and readability limitations, only the highest-ranking topics (based on total verse count) made the list. Are you surprised to see any of them in the top 48? Which ones would you expect to be more prominent that aren’t shown on this chart? What stands out in terms of what different writers emphasize? Please leave your comments below – I’d love to hear some insights.
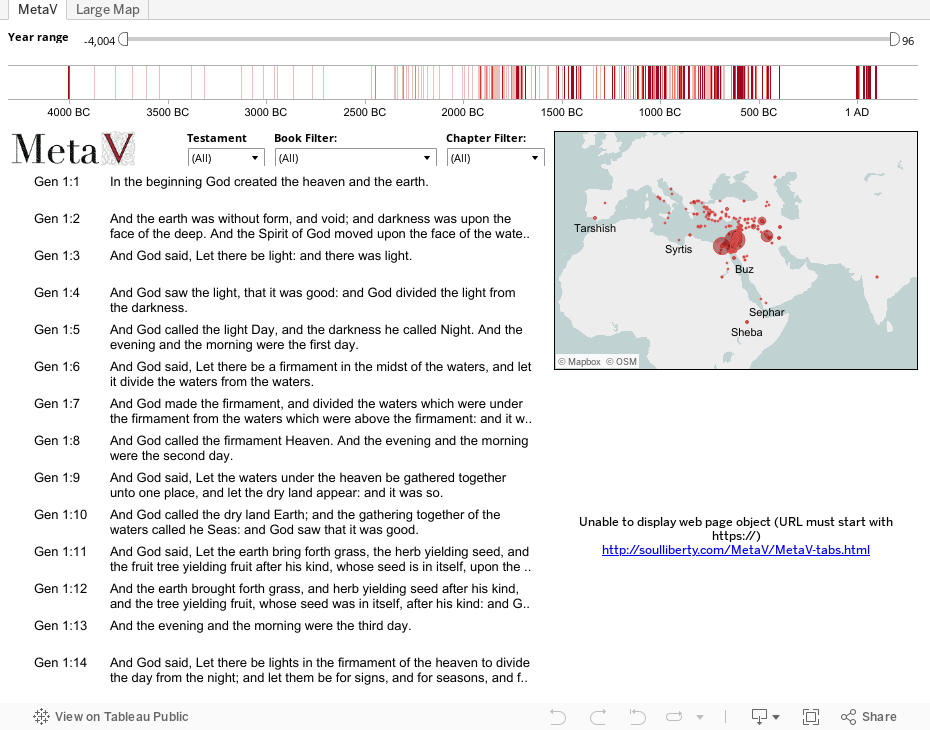
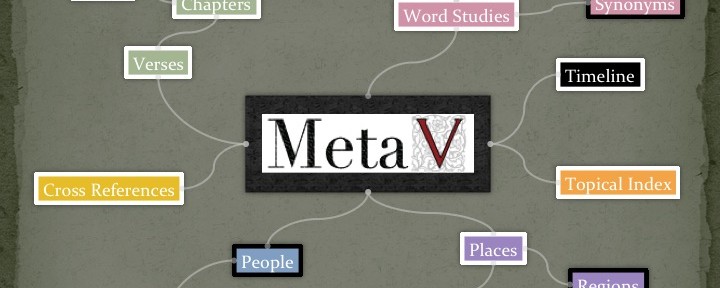
MetaV is the name given to the underlying database used to build the visual Bible explorer on this website and several other infographics. It links together details on people, places, periods of time, and passages in the Bible at word-level detail. This database is specially structured to simplify complex “big picture” analysis or visualizing biblical information.
Above all, the Bible represents absolute truth given from God. The electronic source text of the Bible has been checked for accuracy against multiple other electronic sources of the King James Version using modern text comparison software. The rest of the information in MetaV is nothing more than well-studied conclusions about the Bible formulated and trusted by faithful Christians over the centuries. For more details on original sources, reference the database documentation available in the readme file (included in the downloads below).
How should I navigate the data?
This database is structured so that anyone familiar with spreadsheet applications such as Microsoft Excel can make good use of the information in a variety of ways. Those who have experience with data manipulation and queries will find it simple to perform more advanced analysis. The readme file and schema diagram included in these downloads give an overview of the tables and fields as well as how they are related to each other.
Can I share it with others?
Please do! Our goal is to get the Bible and helpful related information into the hands of as many people as possible. MetaV was built using data obtained from those who have generously shared it with others. In that same spirit, MetaV is free to use and copy under a Creative Commons Attribution Share-Alike license. All we ask is that you let us know where and how the data will be used. Please see the details on individual source files (available at the links below) for more specific usage guidelines.
Click below to download all files.
You can also fork the GitHub repository or, choose individual files from the table below.
Compilation of cross references obtained from R.A. Torrey’s Treasury of Scripture Knowledge (Public Domain). Duplicate cross-references have been excluded.
The main index associating the various tables in this database with individual words. Text used: 1769 Cambridge Edition of the King James Version, also known as the Authorized Version (Public Domain). Tags with references to deity are provided with permission from Bible Analyzer’s AVp module.
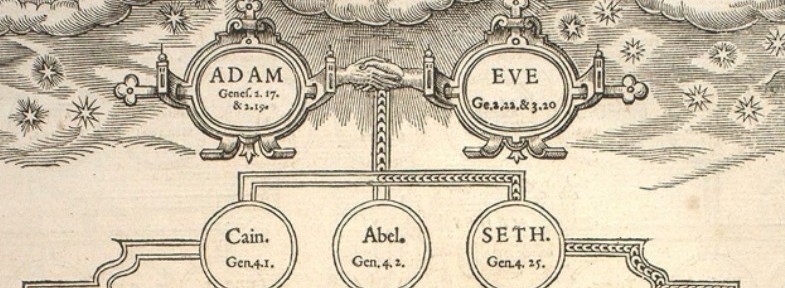
Listing of all people in the Bible and key facts about them. this is a mashup of data found at complete-bible-genealogy.com and www.marshallgenealogy.org/bible. Name spelling has been updated to match the source bible text.
All identifiable places mentioned in the bible. Locations may be approximate. Source: openbible.info/geo (Creative Commons Attribution License). Place references in time periods prior to Noah’s Flood have been removed.
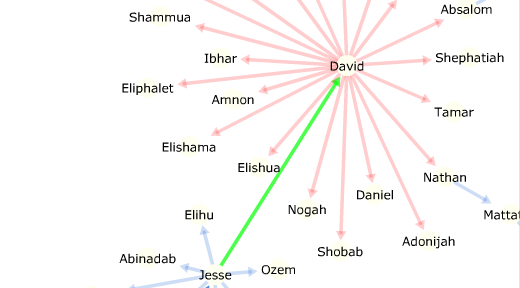
Early this year I discovered a fascinating visualization that mapped all the connections made between “friends” on Facebook. It quickly spread around the internet with many people pointing out how country boundaries appeared from the links themselves with no borders drawn in the background.
So, as is my tendency, I thought about what it might look like to do something similar based on the connections between people and places in the Bible. Once I set out to define these relationships, I quickly found it hard to get the data I would need. Unlike with Facebook, Moses and Aaron had no way to input their personal information in a database that makes it easy to do this kind of thing. The Semantic Bible project has come a long way in terms of explicitly defining relationships among New Testament figures, but nothing yet for the Old Testament which contains far more people and places. Chris Harrison managed a complex visualization of social networks, but it is based strictly on word proximity to generate connections.
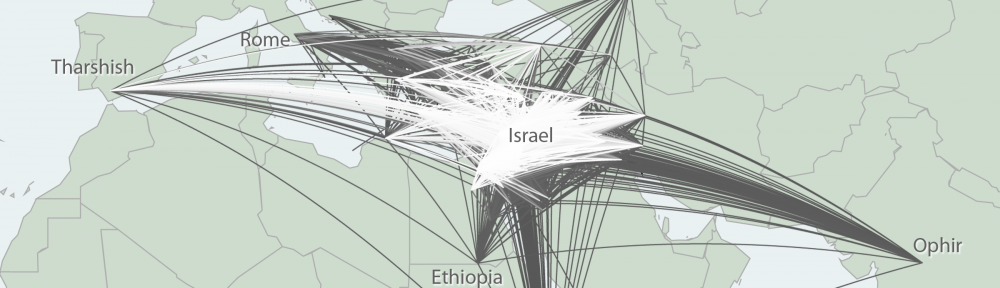
Since MetaV contains genealogical information for everyone in the Bible and geolocation data, I was able to create a composite database of links using both definite relationships and textual proximity. Then, I mapped the data following a very handy tutorial by Nathan Yau at FlowingData. People are linked to places if that person’s name appears in the same sentence as a place name. “Sentence” connections are those which have two people mentioned by name in the same sentence. “Self” links are where one person is linked to multiple places due to travels, marriage, etc. “Spouse” and “Parent” relationships are defined according to available genealogy data.
Color variations are a function of how many times the connection appears and the distance between the places. Lines are drawn along great circle routes in keeping with the Facebook map inspiration.
What is immediately clear (though not at all surprising) is the centrality of Israel. The links within Israel and the ones going around the world are so dense that one can’t help but notice is is at the heart of all the interconnection in scripture, no matter how you slice the data. I would love to hear your thoughts on these patterns, so please leave a comment if you find something interesting!
One’s approach to Bible study has great influence on a person’s views about God and our relationship with him. The set of guidelines I prefer and recommend would be what’s generally known as the inductive bible study method. I find it’s a great way to let the text speak for itself before applying any pre-concieved ideas that may warp its intended, actual meaning. Of course, no single study method must be dogmatically practiced as long as the approach does not impose outside influences that may skew our interpretations (a.k.a “Sola Scriptura”).
Likewise, a person’s approach to understanding any other data set has a huge bearing on their eventual understanding of what that data represents. A flawed approach tends to produce false or misleading statistics, granting that field of study a special category coined by Mark Twain in his famous line: “There are three kinds of lies: lies, damned lies and statistics.” On a blog that I regularly visit, Flowing Data, Nathan Yau does a good job of giving examples of the right and wrong ways to analyze and present data truthfully. The recent release of his book Visualize Thispromises to be as good a resource as his blog. It comes along with a wonderful video (below) that illustrates some important points I’d like to expand on.
I couldn’t have said it better myself. The parallels between this approach to statistics and sound hermeneutics are immediately apparent. Let’s walk through each step and discuss how it corresponds to inductive Bible study and how I believe we can improve upon some areas.
Get Your Data. Normally we choose some passage that is manageable in the time we’ve set aside for study. When studying an entire book, it must be broken into smaller segments. This is a good way for individuals to dig really deep and meditate on certain points, but it can be inadequate and unnecessary for other purposes. Enough people over time have taken this approach, tabulated and published key information that can now be used alongside many other such resources to efficiently study the entire Bible as a whole. The data sets I’ve chosen come from renowned scholars over several centuries, now combined in one linked data set (MetaV).
Ask a Question. Once we’ve chosen what passage(s) to pick apart, we must make some basic observations. What people, places, or time frames are mentioned? Much of this can be gleaned directly from the text, but helps such as maps or time lines are often necessary to really understand where in the world that place is or what else might have been going on in that period of history. This is why MetaV includes a year assigned to every passage and why every identifiable place is given a latitude/longitude.
Choose your tools. These days we’re stuck with either pen and paper or study software which does a great job of putting a microscope on the text, but nothing is yet available which can handle analysis of the entire Bible. If you’re computer-savvy, you may be comfortable with various spreadsheets, databases, or statistical computation tools, but let’s face it – not everyone just loooves to do stats in their spare time!
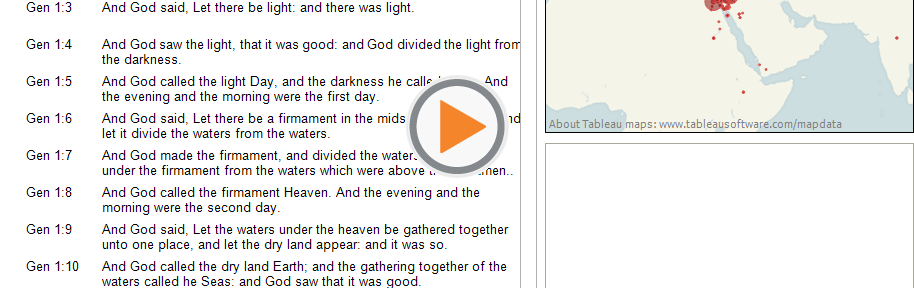
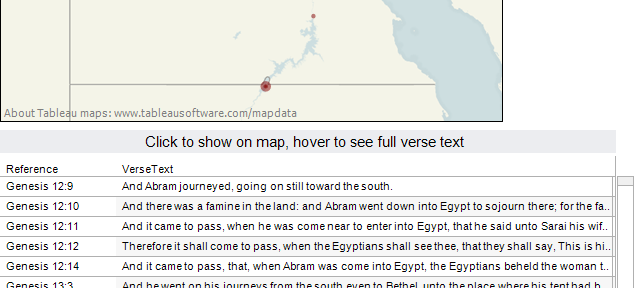
Explore. This goes along with the observations you may have when asking some basic questions, but now it may be expanded to look for trends, patterns, and differences. Like the video points out, it’s useful to compare things according to categories, space, and time. The only real way to do this on a scale larger than a chapter or two is to take each place mentioned in the passage and find it on a map (hopefully one that corresponds with the time period you’re studying) or take a similar approach to finding/plotting events through time. To help in that regard, you may find this interative visual to be useful. On a smaller scale, highlighting key elements by marking them with colors and shapes can help you identify repeating or contrasting phrases. Wouldn’t it be nice, though, if your study tools did that for you, allowing one to apply this to everything in the Bible at once so you can spend more time thinking and less time marking? I think that day is fast approaching.
Get your story. Once you have some idea of what’s being emphasized, compared, or explained, it’s time to put it all together. What does this text actually mean? How does it relate to other stories? How does it relate to your own life?
Design your visual. It’s just not enough that you understand it. You want to share what you’ve learned…but how? How might you communicate key points in a meaningful, truthful way without simply reciting the text or handing over a list of raw data? This is another reason why most analysis, both biblical and otherwise, is limited to smaller, more manageable bites. It’s a fairly unique skill set to handle large volumes of facts and communicate them in a way that isn’t overwhelmingly complex or else too watered-down for the sake of simplicity. I am finding more and more folks out there like Nathan Yau who are teaching others these skills and I’m learning a great deal from their online resources. I sincerely hope that the visuals on this blog do a decent job of that for you as well.
This is just one of the ways that I believe MetaV can be applied to broaden our understanding – taking the Bible as a whole, seeking common or diverging elements while remaining true to the intent of each individual passage. If you’re looking for other ways to understand the data in MetaV, keep checking this blog for upcoming visualizations or do what I do: find sites like Flowing Data to get some ideas and “how-to” articles. Then, let me know what you come up with by leaving your comments below.
MetaV 2.0 is now available to download as an Access database or as a group of csv files. I have attempted to make it as easy as possible to understand the structure of the data, but feel free to leave a comment if you have any questions.
This is perhaps the most complex undertaking I’ve ever engaged in and I know it simply would be impossible without the ongoing guidance and helping hand of the Lord our God. There are many improvements that can and will be made in future versions, but the time for collecting information is past and the time for turning it into action is upon us. As I’ve seen from the response to my infographic, “Mapping God’s Bloodline,” visual presentations of biblical data can reach far and wide, gaining influence in some of the most unlikely sectors of our society.
MetaV provides the foundation for more visualizations of this type. With it, data experts can correlate biblical people, places, and timelines in ways not yet imagined. For the foreseeable future, I shall be focused on bringing the big picture of the Bible into view using modern data techniques. I welcome your ideas and would be happy to share on this blog any visualizations or analyses you have performed.
I’ve spent some time already on this blog talking about the ideas behind MetaV: what it is, why it’s different, etc. Now, the map and timeline data is complete and the first visual exploration tool is here. This work is not licensed, so feel free to share, copy, and modify as you wish.
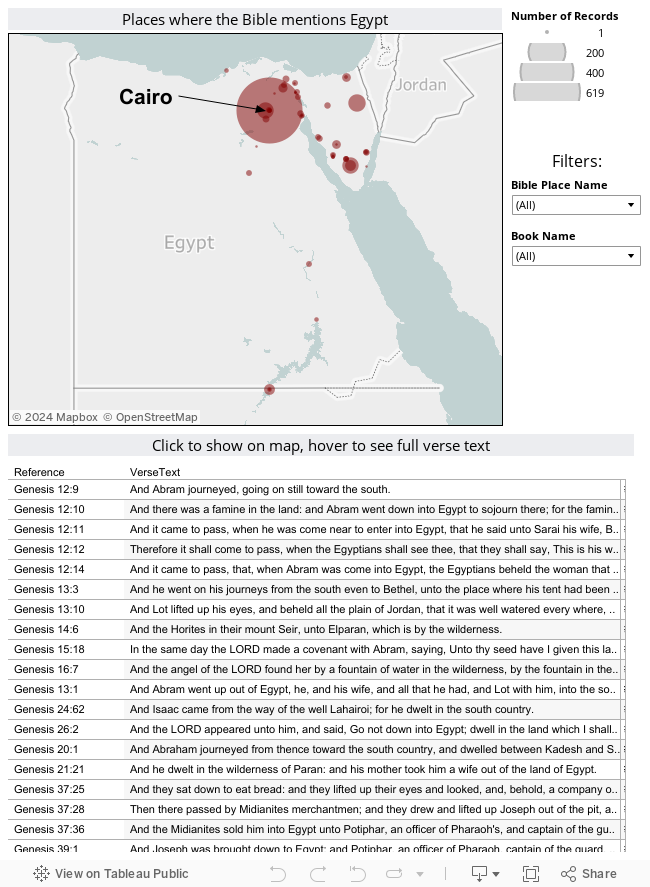
With the recent uprising in Egypt, I thought it would be worthwhile to get a little historical context. What better place to go than the Bible? Take a look at this interactive map to see all the places in modern-day Egypt that are mentioned in the Bible.
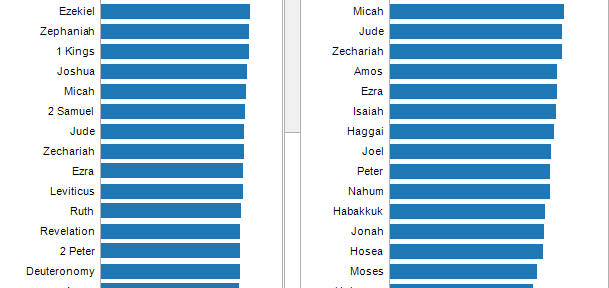
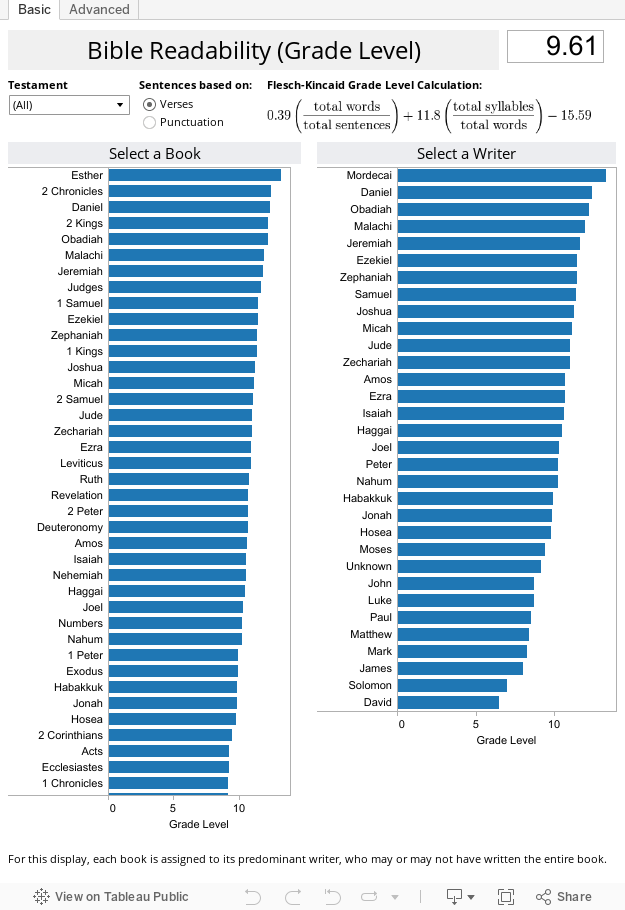
There are numerous claims about the readability of various English Bible translations. The chart below is the result of my own calculations using the standard Flesch-Kincaid grade level formula. Many other readability calculations do not specify whether sentence lengths are based on punctuation or verse divisions. This tool allows you to see it either way. In some sections, the results are wildly different.
This tool also makes it easy to find readability levels for each author, book and chapter (on the advanced tab), unlike the more general readability comparisons you may have seen already. Due to copyright restrictions, it is difficult to obtain electronic versions of the entire text of translations other than the KJV, so at the moment we do not have a simple tool available for comparing readability accross different versions.